 Smart
SmartEvery forex trade has a ticket price, and most traders have only a vague idea what it is. The spread is the obvious one. Commissions are straightforward if you read the fine print. But when you add overnight swap, slippage, and the compounding effect across hundreds of trades, the true cost of trading can consume 15-20% of a mid-sized account annually. We ran the numbers across three broker models to show exactly where the money goes.
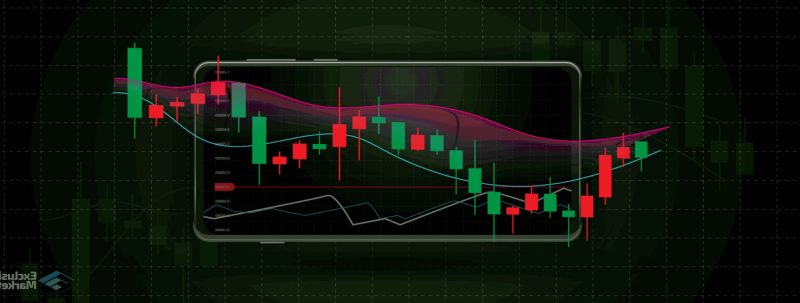
The Spread Is Not a Fee — It Is Worse
Every Trade Starts Underwater
A spread is not like a brokerage fee that appears as a separate line on your statement. It is built into the price itself, which makes it both invisible and unavoidable. The moment you open a position, you are already losing money.
Here is the arithmetic. If NZD/USD is quoted at 0.6148 bid / 0.6150 ask, the spread is 2 pips. You buy at 0.6150, but if you wanted to close immediately, you would sell at 0.6148. That 2-pip gap is your cost of entry. On a standard lot (100,000 units), each pip on NZD/USD is worth approximately USD 10, so a 2-pip spread costs you roughly USD 20 — about NZD 32 at current exchange rates.
That NZD 32 is gone the instant you click buy. Your trade needs to move 2 pips in your favour just to break even. On a tighter spread of 0.8 pips, the break-even threshold drops to about NZD 13. The difference sounds small on a single trade, but it compounds relentlessly across hundreds of trades per year. The spread is the most significant cost most retail traders pay, and it is the one they think about least — precisely because it never appears as a separate charge.
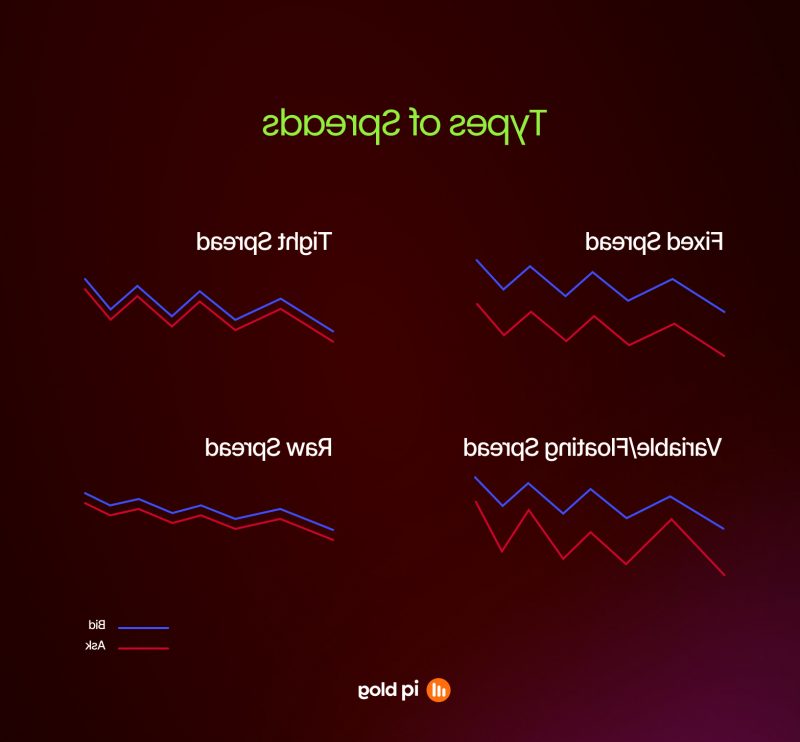
Fixed vs Variable: When the Spread Lies to You
Fixed spreads offer certainty. Your broker quotes NZD/USD at 1.5 pips regardless of market conditions — same spread at 2pm on a Tuesday as at the moment the RBNZ announces a surprise rate hold. That predictability has a price: the fixed spread is wider than the variable average, because the broker builds in a buffer to cover the occasions when the real market spread blows out.
Variable spreads track actual market conditions. During the Sydney-London overlap, when NZD liquidity peaks, you might see spreads of 0.6-0.8 pips. During the New York close, they might drift to 1.2 pips. And during major data releases — RBNZ decisions, NZ employment data, US non-farm payrolls — variable spreads can spike to 5, 8, even 15 pips for a few seconds.
Which model costs less depends entirely on when and how you trade. A scalper executing 20 trades during the most liquid four hours of the day will almost always pay less with variable spreads. A trader who holds positions through news events might prefer the fixed-spread certainty, even at a premium. The mistake is assuming one model is inherently cheaper. It is not. It depends on your trading pattern, and the only way to know is to track your actual execution costs over a meaningful sample of trades.
The 0.1 Pip Difference That Costs You Hundreds
Small spread differences feel irrelevant on any single trade. The difference between a 1.0 pip spread and a 1.1 pip spread on one standard lot of NZD/USD is about NZD 1.60. Nobody changes broker over NZD 1.60.
But trading is not a single-trade proposition. Consider a moderately active trader: 5 round-trip trades per day, 1 standard lot each, across 220 trading days per year. That is 1,100 trades annually. At 0.1 pip difference per trade, the annual cost gap is approximately NZD 1,760. At 0.3 pips — the kind of difference commonly found between a mid-range broker and a competitive ECN — the gap widens to roughly NZD 5,280 per year.
For perspective, NZD 5,280 is the difference between a breakeven year and a meaningful return on a NZD 50,000 trading account. It is 10.5% of your capital, evaporated through spread alone before you consider commissions, swap, and slippage.
This is why professional and semi-professional traders obsess over execution costs. It is not miserliness. It is the recognition that in a zero-sum market, costs are the one variable entirely within your control. You cannot control whether your next trade wins or loses. You can control how much you pay to place it.
Commission Models and the Maths That Matters
Spread-Only vs Commission-Plus-Spread
Retail forex brokers generally offer one of two pricing structures: spread-only or commission-plus-spread.
Spread-only accounts are the default for most market maker brokers. All costs are embedded in a wider spread. If the interbank spread on NZD/USD is 0.2 pips, your broker might quote 1.2-1.6 pips, keeping the difference as revenue. There is no separate commission line on your statement. The appeal is simplicity — you see one number and that is your cost.
Commission-plus-spread accounts, common with ECN and STP brokers, work differently. You get access to tighter spreads (often 0.1-0.4 pips on NZD/USD during liquid sessions) and pay a fixed commission per lot traded. A typical commission is USD 3.50 per side (USD 7.00 round-trip per standard lot).
The comparison requires converting everything to the same unit. A spread-only account at 1.4 pips all-in versus a raw spread account at 0.2 pips plus USD 7 commission. That USD 7 commission converts to approximately 0.7 pips on NZD/USD, making the all-in cost 0.9 pips. The raw spread account is 0.5 pips cheaper per trade.
For a trader doing 100 lots per month, that 0.5 pip saving is roughly NZD 800 monthly — nearly NZD 10,000 per year. The break-even point is lower than most people expect: even traders doing 20-30 lots per month typically find the commission model cheaper, provided they trade during liquid hours when raw spreads are tight.
Per-Lot, Per-Side, Per-Million: Reading the Fine Print
Commission structures are designed to confuse comparison shoppers. Broker A quotes USD 3.50 per side per standard lot. Broker B quotes USD 7.00 per round turn per lot. Broker C quotes USD 35 per million. These are all roughly the same charge, expressed three different ways.
The per-side figure is what you pay to open a position. You pay it again when you close. So USD 3.50 per side means USD 7.00 for a complete trade (open and close). Always convert to round-trip cost per standard lot for comparison.
Per-million pricing is common with institutional-facing brokers. One standard lot of NZD/USD is a USD 100,000 notional position, so USD 35 per million translates to USD 3.50 per lot — the same as the first example.
Some brokers tier their commissions by monthly trading volume. You might pay USD 7 round-trip for the first 50 lots per month, dropping to USD 5 at 100 lots and USD 3.50 at 500 lots. These tiers can shift the economics significantly for active traders, and they are worth negotiating. If you trade consistent volume, contact your broker account manager and ask for better rates. Many brokers have flexibility that is not advertised on their pricing pages.
The All-In Cost: Converting Everything to Pips
To compare brokers honestly, convert every cost into pip equivalents for the pair you trade most. This gives you one number — the all-in cost per trade in pips — that works across any pricing model.
For NZD/USD, a pip is worth approximately USD 10 on a standard lot. To convert commission to pips: divide the round-trip commission in USD by 10. A USD 7 round-trip commission equals 0.7 pip equivalents.
Now the comparison is straightforward:
– Broker A: 1.4 pip spread, no commission — all-in cost is 1.4 pips
– Broker B: 0.2 pip raw spread plus USD 7 commission (0.7 pips) — all-in cost is 0.9 pips
– Broker C: 0.5 pip spread plus USD 5 commission (0.5 pips) — all-in cost is 1.0 pip
You can apply this same conversion to any pair, though the pip value changes. On EUR/USD, a pip is also approximately USD 10 per standard lot, so the maths is identical. On cross pairs like NZD/JPY, a pip is worth roughly JPY 1,000 per standard lot — you would need to convert the commission into JPY terms first.
The all-in pip cost is the only honest way to compare pricing. Marketing pages emphasise whichever number looks best — “spreads from 0.0 pips” ignores commission, while “zero commission” ignores a wider spread. Calculate the all-in figure yourself.
Overnight Swap: The Cost Nobody Budgets For
What Swap Is and Why You Pay It
Every leveraged forex position held past 5pm New York time (10am the following day in New Zealand during daylight saving) incurs a swap charge or credit. The swap reflects the overnight financing cost of maintaining a leveraged position — you are borrowing one currency and lending another, and interest rates apply.
The calculation is based on the interest rate differential between the two currencies in the pair. If you are long NZD/USD, you are effectively borrowing USD (at US interest rates) and holding NZD (earning NZ interest rates). If NZ rates are higher than US rates, you receive a small credit. If they are lower, you pay.
In practice, the swap you see on your platform bears only a loose resemblance to the theoretical interbank rate. Brokers add their own markup — typically 1-3% annually on top of the rate differential — which is why swap is almost always negative regardless of which direction you hold. Some brokers charge swap on both long and short positions for certain pairs, meaning there is no free ride in either direction.
Wednesday nights carry a triple swap charge, accounting for the weekend settlement cycle. Holding a position from Wednesday to Thursday costs three days of swap, even though the market is open for only one day. This quirk catches swing traders who are not paying attention to the calendar.
NZD Pairs and the Interest Rate Factor
For NZ-based traders, the interest rate differential on NZD pairs has shifted meaningfully over the past two years as central banks have moved at different speeds.
The NZD/JPY pair illustrates this most clearly. For years, long NZD/JPY was a classic positive-carry trade — NZ rates significantly above Japanese rates meant you earned swap for holding the position. As the Bank of Japan has gradually moved away from ultra-loose policy while the RBNZ has been cutting, that differential has narrowed. The positive swap on long NZD/JPY is smaller than it was, and some brokers now charge negative swap in both directions after their markup.
On NZD/USD, the swap depends on the OCR-to-Fed Funds rate gap. With the RBNZ cutting rates while the Federal Reserve holds, short NZD/USD positions currently earn a modest swap credit on most platforms, while long positions carry a cost. Realistic current figures from major brokers show long swap of roughly -0.5 to -0.8 pips per night and short swap of +0.1 to +0.3 pips per night on a standard lot.
NZD/AUD swap is typically small in either direction because the RBNZ and RBA tend to move in roughly similar cycles. The differential is narrow, which means the broker markup dominates — and you often pay in both directions.
Always check the current swap table on your specific broker platform before entering any trade you plan to hold overnight. Published rates change frequently and vary significantly between brokers.
Swing Traders: When Swap Eats Your Edge
Day traders close positions before the 5pm New York rollover and avoid swap entirely. Swing traders do not have that option, and for them, swap is a line item that deserves the same attention as spread and commission.
Consider a concrete scenario. You go long 1 standard lot of NZD/USD on Monday morning, expecting a move based on upcoming NZ employment data released on Wednesday. The trade goes well — price moves 30 pips in your favour by Thursday afternoon and you close the position.
Over four nights (Monday to Thursday, including triple swap on Wednesday), the swap cost might total approximately 3.0-3.5 pips equivalent — that is 10-12% of your gross profit, absorbed by financing costs alone. On a more modest 15-pip winner held for the same period, swap consumes 20-23% of your gain.
The calculus changes further when the trade goes against you or moves sideways. A position that drifts for two weeks waiting for a catalyst can accumulate 7-10 pips in swap costs, potentially turning a small winner into a loser.
Practical responses include checking swap rates before entering a swing trade and incorporating them into your profit target. If your target is 40 pips and you expect to hold for five days, add roughly 4-5 pips of swap to your cost basis. Close and reopen positions if the market gives you the opportunity to reset the swap clock. And for pairs where swap is punitive in both directions, favour shorter holding periods.
Calculating Your True Trading Cost
Slippage: The Cost That Does Not Appear on Your Statement
Slippage is the difference between the price you expected to trade at and the price you actually received. Unlike spread and commission, it does not appear as a named charge on your account statement. It simply manifests as a slightly different entry or exit price.
On a market order during normal conditions, slippage on NZD/USD is typically 0.1-0.3 pips. You might not notice it on any individual trade. But like the spread, it compounds. Over 1,000 trades per year, even 0.2 pips of average negative slippage adds approximately NZD 3,200 to your annual costs.
Slippage is not random. It correlates with volatility, liquidity, and order size. During major data releases — RBNZ rate decisions, NZ employment numbers, US non-farm payrolls — slippage can spike to 1-5 pips or more. If you are trading with market orders during these events, you are paying a significant and unpredictable premium.
The asymmetry matters too. Academic studies and broker execution data consistently show that negative slippage (you get a worse price) occurs more frequently than positive slippage (you get a better price) for retail traders using market orders. This is not necessarily manipulation — it reflects the speed disadvantage of being at the end of the execution chain. The price moves in the time between your click and your fill, and in fast markets, it is more likely to move against the slower participant.
A Real Cost Audit: NZD/USD Across Three Broker Types
Abstract cost comparisons are useful, but concrete numbers drive better decisions. We will model a specific scenario: a trader executing 100 standard lot round-trip trades per month in NZD/USD, with roughly 40% of positions held overnight.
Broker type one: market maker, 1.4 pip fixed spread, no commission. Spread cost is 100 trades multiplied by USD 14 (1.4 pips at USD 10 per pip), totalling USD 1,400. Average slippage at 0.1 pips adds USD 100. Swap on 40 overnight positions at an average of 0.6 pips each adds USD 240. Monthly total: approximately USD 1,740, or about NZD 2,820.
Broker type two: STP, 0.8 pip average variable spread plus USD 5 commission round-trip. Spread cost is USD 800, commission is USD 500, slippage at 0.15 pips is USD 150, and swap on 40 positions at 0.7 pips is USD 280. Monthly total: approximately USD 1,730, or NZD 2,805.
Broker type three: ECN, 0.2 pip average raw spread plus USD 7 commission round-trip. Spread is USD 200, commission is USD 700, slippage at 0.15 pips is USD 150, and swap on 40 positions at 0.5 pips is USD 200. Monthly total: approximately USD 1,250, or NZD 2,030.
The annual difference between the most and least expensive option is roughly NZD 9,480. On a NZD 50,000 trading account, that is nearly 19% of capital consumed by execution costs alone.
Where the Savings Actually Are
The numbers above suggest where to focus, and the priority order is clear.
First, choose the right broker model for your trading frequency. The ECN model saves the most for traders executing 50 or more lots per month. Below that volume, the savings narrow and the higher minimum deposits may not justify the switch. Run the calculation with your actual trading frequency before moving.
Second, trade during high-liquidity sessions. For NZD pairs, the tightest spreads occur during the Sydney-London overlap (roughly 5pm-9pm NZ time during winter, 7pm-11pm during summer). Avoiding the thin liquidity of the late New York session and the Friday close can reduce average spreads by 0.2-0.4 pips without changing anything else about your strategy.
Third, use limit orders where your strategy allows. A limit order specifies the price you want and waits for the market to meet it. There is no slippage — the order fills at your price or not at all. Scalpers cannot always wait, but swing traders entering on pullbacks can place limit orders at their target entry and eliminate slippage entirely on those trades.
Fourth, manage swap exposure on longer trades. Check the swap table before entering, factor financing costs into profit targets, and favour shorter holding periods on pairs where swap is punitive in both directions.
Fifth, for traders with consistent monthly volume above 100 lots, contact your broker and negotiate commission rates. This is standard practice in institutional trading, and many retail brokers regulated by the Financial Markets Authority have the flexibility to reduce published rates for reliable volume. The worst they can say is no.
Trading costs are the only variable in forex that is entirely within your control. You cannot will the market to move in your direction, but you can choose a pricing model that fits your frequency, trade during sessions when spreads are tightest, and stop paying for overnight financing you have not accounted for. The traders who survive long enough to become profitable are almost always the ones who got their costs right first.