 Smart
SmartEvery forex course teaches support and resistance as if drawing lines on charts is the hard part. It is not. The hard part is distinguishing between levels that will hold and levels that will break — and understanding why institutional order flow, not your trendline, is the force that makes price stop where it does.
We work through a practical framework for NZD pairs, using recent NZD/USD price behaviour to illustrate why thinking in zones rather than lines changes the way you trade.
Why Price Stops Where It Does
Institutional Order Flow Creates the Levels That Matter
The textbook explanation of support and resistance — buyers meet sellers at a price — is technically correct and practically useless. It describes the symptom without explaining the cause. Why do buyers appear at 0.5850 and not 0.5847? Why does NZD/USD consistently stall at certain levels and slice through others like they are not there?
The answer lies in institutional order flow. Banks, sovereign wealth funds, central banks, and large corporate hedgers do not place market orders the way retail traders do. They place resting limit orders — large blocks of liquidity sitting at specific price levels, often placed days or weeks in advance. An NZ dairy exporter hedging next quarter’s receivables might place a sell order for NZD/USD at 0.6000 with their bank. A Japanese institutional investor might have a buy order for NZD/JPY at 88.00. These orders create genuine supply and demand at specific prices.
When price approaches a level where significant institutional orders are resting, it either absorbs those orders and pushes through, or it bounces off them. The level holds because real money is sitting there, not because a line on a retail trader’s chart says it should.
This is fundamentally different from the support and resistance you draw by connecting previous highs and lows. Those levels may coincide with institutional order flow — and often do, because institutional traders read the same charts — but the chart line itself is not the cause. The cause is capital.
Round Numbers and the Psychology of the Kiwi Dollar
NZD/USD round numbers exert a gravitational pull on price that is disproportionate to any technical justification. The levels at 0.5800, 0.5900, 0.6000, 0.6100, and 0.6200 attract more resting orders, more option barriers, and more trading attention than the prices ten pips above or below.
The reasons are partly mechanical and partly psychological. On the mechanical side, FX option barriers are frequently placed at round numbers. A barrier option at 0.6000 means that a bank has a significant financial interest in preventing NZD/USD from trading above that level — and they will sell NZD as price approaches to defend the barrier. This creates genuine selling pressure at the level, not just a line on a chart.
Corporate hedging orders cluster at round numbers too. A Wellington-based importer told to hedge their USD exposure does not typically place an order at 0.5937. They tell their bank to buy USD if NZD/USD reaches 0.5900 or 0.6000. Multiply this across hundreds of corporates and you have a meaningful concentration of orders at clean psychological levels.
The self-fulfilling dimension amplifies the effect. Because traders know round numbers attract attention, they place their own orders there, adding to the cluster. NZD/USD has tested and bounced off 0.6000 repeatedly across multiple years — not because 0.6000 has intrinsic significance, but because enough capital treats it as significant that it behaves as if it does.
For practical trading, round numbers on NZD pairs deserve more respect than other levels.
Historical Pivots vs Dynamic Levels
Not all support and resistance levels are the same type, and conflating them leads to poor trading decisions.
Historical pivots are fixed prices: the previous weekly high, last month’s low, a significant swing point from three months ago. These are static — they do not move as new price data arrives. Their strength comes from the volume of traders who participated at that price. A weekly high that formed on heavy volume represents a price where the market decisively rejected further upside. That memory persists, and when price revisits the level, the same dynamics tend to repeat.
Dynamic levels — moving averages and trendlines — shift with each new candle. The 200-day moving average on NZD/USD is genuinely watched by institutional desks. It functions less as a precise level and more as a zone of interest: when NZD/USD approaches the 200-day MA from below, institutional traders who use it as a trend filter begin adjusting positions, creating a self-reinforcing reaction at the level.
For NZD pairs in a ranging market, historical pivots are more reliable. Price bounces between established highs and lows with reasonable consistency, and horizontal levels provide clearer entry and exit points. In a trending market, dynamic levels do the heavier lifting. A rising 50-day MA during an NZD uptrend acts as a moving support that institutional buyers reference for pullback entries.
The practical takeaway: mark both types on your chart, but weight them differently depending on market conditions.
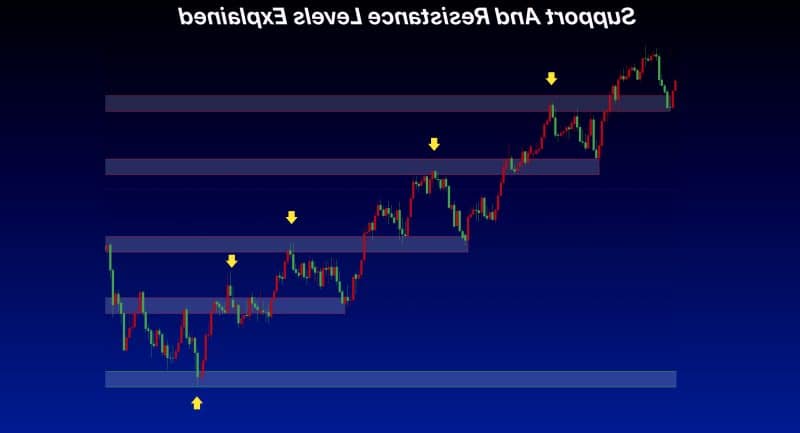
The Difference Between a Line and a Zone
Draw a single horizontal line at 0.5900 on an NZD/USD chart and you will be precisely wrong a good portion of the time. Price does not respect exact levels — it respects zones.
A support zone on NZD/USD might span from 0.5890 to 0.5915. Within that band, you see clusters of candle closes, multiple wick rejections, and repeated reversals that do not occur at exactly the same price. The zone represents the area where institutional order flow is concentrated, not a single price where a wall of orders sits.
Defining zone width is part art, part method. Start with the wicks. On a daily chart, look at the swing low: the closing price might be 0.5908 but the wick extends to 0.5892. The zone runs from the wick low to the cluster of closes around the reversal point. A zone of 15-25 pips is typical for NZD/USD on the daily timeframe. On shorter timeframes, zones tighten — a 4-hour chart might show a 10-15 pip zone at the same level.
NZD pairs test support and resistance zones with false breaks before committing. Price dips below the zone low by 5-10 pips, triggering stops placed just under the line, then reverses sharply back into the range. Traders who placed their stop at exactly 0.5900 get taken out. Traders who recognised the zone and placed their stop below 0.5885 survive the false break and catch the reversal.
The shift from thinking in lines to thinking in zones changes your trading in two specific ways: your entries become more patient (wait for price to enter the zone rather than reacting at the first touch of a line) and your stops become more intelligent (placed beyond the zone rather than just beyond the line).
Telling the Levels That Hold from the Ones That Break
Volume, Momentum, and the Conviction Test
A level exists on the chart. Price is approaching it. The question that pays: will it bounce or break?
Volume provides the most honest answer. When price approaches a support level on declining volume, the move lacks conviction — sellers are running out of steam, and a bounce is more likely. When price approaches the same level on increasing volume, sellers are committed, and a break becomes the higher-probability outcome. Most retail platforms now offer volume data or tick volume as a proxy, and while forex volume is decentralised and imperfect, the directional signal is useful.
Momentum indicators add a second layer. RSI divergence at a support level — price making a lower low while RSI makes a higher low — suggests the selling pressure is weakening. This divergence does not guarantee a bounce, but it shifts the probability. Conversely, if price approaches support with RSI already oversold and still declining, the momentum is against a reversal.
The number of prior tests matters more than most traders appreciate. A support level that has held three times carries a reputation for strength. But each test absorbs some of the resting orders at that level. By the fourth or fifth test, the buy orders that previously defended the level have been partially filled, and the remaining liquidity is thinner. The market aphorism is correct: the more times a level is tested, the more likely it is to break.
False Breaks: The Market Fishing for Stops
You set a stop three pips below support at 0.5900. Price drops to 0.5894, triggers your stop, then reverses and closes the day at 0.5930. You were right about the direction and still lost money. Welcome to the false break.
False breaks are not random bad luck. They are a structural feature of how modern forex markets operate. Algorithmic trading systems and institutional desks know where retail stops cluster — just below visible support and just above visible resistance. When price approaches a well-defined level, these participants push it slightly beyond to trigger the stop cluster, creating a burst of selling (or buying) that they absorb at favourable prices. The price then reverses as the artificial pressure dissipates and genuine order flow reasserts itself.
Identifying a false break in real time requires watching the candle close, not the wick. A wick that pierces support by 10-15 pips but closes back above it is the classic false break signature. The piercing happened; the commitment did not. If you wait for a candle close beyond the level before acting, you avoid the majority of false breaks — at the cost of occasionally entering late on genuine breaks.
A more aggressive approach treats false breaks as entry signals. If price pierces support, triggers stops, and immediately reverses, the false break itself becomes a high-probability long entry. The logic is that the stop-hunting move has already cleared out weak sellers, and the reversal indicates that genuine buyers are defending the level. Enter on the reversal candle with a stop below the false break wick. The risk is defined and the reward, if the level holds, is substantial.
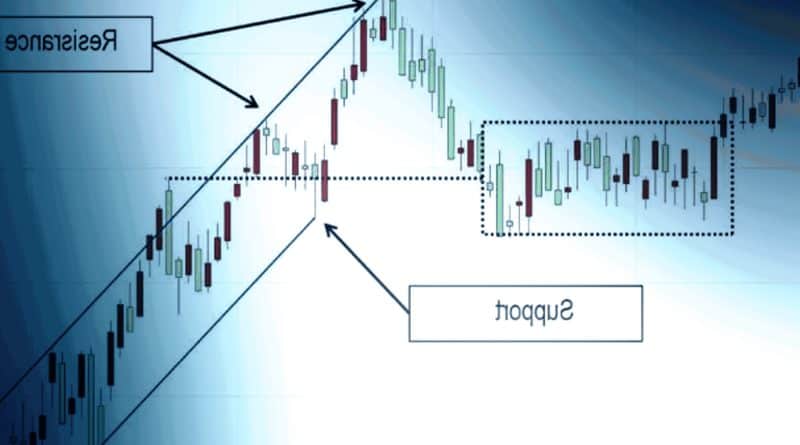
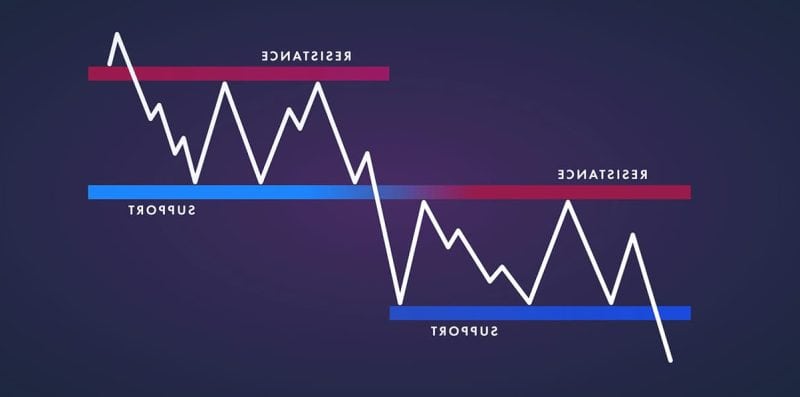
When a Level Flips: Support Becomes Resistance
One of the most reliable patterns in NZD pair trading is the support-resistance flip: a level that previously acted as support, once broken, becomes resistance on the retest from below. The reverse applies equally — broken resistance becomes support.
The mechanics are straightforward. Suppose NZD/USD has been supported at 0.5950 for three weeks. Traders who bought at that level have positions that are at or near breakeven. When price breaks below 0.5950 and these traders are now holding losing positions, the most common reaction is to look for an exit at their entry price. When price retests 0.5950 from below, these traders sell to get out flat, creating selling pressure at the exact level that previously attracted buyers. Trapped traders become the supply.
Unfilled institutional orders add to the dynamic. If a bank had a sell order at 0.5950 that was only partially filled during the initial break, the remaining order sits at that price, ready to be triggered on the retest. The level flips because the participants have changed roles.
NZD/USD provided a clean example of this in the second half of 2023, when the 0.6050 level acted as support through September, broke in October, and then acted as resistance through November. Traders who recognised the flip had a clear short entry on the retest with a defined stop above the level.
Level flips work best when the initial break is decisive — a strong daily close beyond the level on above-average volume. A marginal break followed by a slow drift back is less likely to produce a clean flip because the trapped-trader dynamic is weaker.
Putting It Together: A Working Framework for NZD Pairs
Building a Level Map Before You Trade
Before placing any trade on an NZD pair, build a level map. This takes ten minutes and saves you from the reactive, chart-staring mode that leads to impulsive entries.
Start with the monthly chart. Identify the major swing highs and lows from the past twelve months. On NZD/USD, these might be the 2024 high near 0.6370, the low near 0.5770, and two or three intermediate pivots. These are the structural levels — the ones that take significant fundamental shifts to break. Mark them in one colour and leave them alone.
Move to the weekly chart. Identify the highs and lows from the past eight to twelve weeks. These are the levels that active swing traders are watching and where the current trading range is defined. There will typically be four to six weekly-level pivots worth marking. Use a second colour.
Finally, the daily chart. Identify this week’s and last week’s high and low, any levels where multiple daily candles showed wick rejections, and any obvious level flips from the recent past. These are the active levels for your current trading decisions.
The temptation is to mark every visible pivot and turn your chart into a rainbow of horizontal lines. Resist this. If you have marked more than five or six levels on a daily chart, you have too many. Prioritise the levels with the most touches, the highest volume on the initial formation, and the clearest alignment across timeframes.
The map is a filter, not a prediction. It tells you where the market is likely to react, allowing you to focus your analysis on those specific zones rather than staring at every tick.
Trading the Bounce vs Trading the Break
When price reaches a level on your map, you have two strategic options. The choice between them depends on the market context, not on your personal preference.
Bounce trading — buying at support or selling at resistance — is a mean-reversion strategy. It works best in ranging markets where NZD pairs are trading between established boundaries. The entry requires confirmation: a bullish engulfing candle at support, a pin bar rejection, or a reversal on the 4-hour chart after a touch of the daily zone. Entering on the first touch without confirmation is a coin flip; entering on confirmation after the touch shifts the odds in your favour.
The stop sits below the support zone — below the wicks, not below the line. If your support zone spans 0.5890 to 0.5910, the stop goes at 0.5880 or lower. The target is the next significant level above, which might be 0.5960 or 0.6000. A typical bounce trade on NZD/USD offers 1.5:1 to 2.5:1 reward-to-risk when the levels are well-defined.
Break trading — entering after price breaks through a level — is a momentum strategy. It suits trending markets where NZD pairs are making higher highs or lower lows. The critical rule: wait for a candle close beyond the level, not just a wick. Then wait for the retest. Price breaks above resistance at 0.5960, closes above it on the daily chart, then pulls back to retest 0.5960 as new support. The retest entry is lower risk than the breakout entry because it confirms the level has flipped.
Break trades have a lower win rate than bounce trades — many breakouts fail and reverse. But when they work, the reward is larger because you are trading in the direction of a new trend.
Levels Are Context, Not Signals
The most common mistake with support and resistance analysis is treating levels as signals. A level tells you where something interesting is likely to happen. It does not tell you what will happen or what you should do about it.
Price arrives at support. That is a location, not a trade. The level brings you to attention — it says the probability of a reaction has increased. What you do next depends on what you observe at that level: the candlestick pattern, the volume profile, the momentum reading, the broader trend direction, and the fundamental backdrop.
If NZD/USD touches support at 0.5900 during a strong downtrend driven by deteriorating NZ economic data, the level is less likely to hold than if price touches it during a ranging market with no directional catalyst.
Support and resistance analysis is one input in a broader decision framework. It answers the question “where” but not the questions “what” or “when.” Combine it with momentum analysis (is the trend supporting a bounce or a break?), volume analysis (is there conviction behind the move?), and fundamental context (is there a reason the Kiwi should reverse here?) to arrive at a trade decision.
The traders who use levels well are the ones who treat them as context for other analysis. They mark their levels before the session, then wait for price to reach one. At the level, they shift from watching to analysing — looking for the combination of signals that turns a location into a trade. The levels are not the strategy. They are the map that tells you where to deploy your strategy.
Support and resistance levels are not a trading system. They are a map of the places where capital concentrates and decisions cluster.
The traders who profit from them are not the ones who draw the most precise lines but the ones who read the context at each level — volume, momentum, candlestick behaviour, fundamental backdrop — and act on the combination rather than the line alone.