 Smart
SmartMost forex education starts with “the forex market is the largest financial market in the world” and then skips straight to candlestick patterns. That gap — between knowing the market is big and understanding how it actually functions — costs traders money.
When you click buy on NZD/USD, your order passes through a chain of intermediaries that each take a cut, and the structure of that chain determines your execution quality, your costs, and your realistic edge. This is the plumbing that nobody explains.
The Interbank Market Is the Actual Market

The Dozen Banks That Set the Price
The forex market has no floor, no building, and no central computer matching buyers with sellers. It is, at its core, a network of about a dozen global banks trading currencies directly with each other. Citigroup, JPMorgan, UBS, Deutsche Bank, Barclays, and a handful of others account for roughly half of all forex turnover worldwide, according to the Bank for International Settlements Triennial Survey.
These banks quote bid and ask prices to each other continuously. When Citi offers to buy EUR/USD at 1.0850 and Deutsche Bank offers to sell at 1.0851, that exchange — multiplied across thousands of simultaneous transactions — is what we call the forex market. Price discovery happens here, in the interbank network, not on your MT4 chart.
The prices you see on your retail trading platform are derived from this interbank activity, filtered through several intermediaries, each adding their own margin. The interbank rate is the wholesale price. What you trade is the retail markup. Understanding this distinction is the foundation of understanding everything else about how your trades actually work.
No Central Exchange, No Opening Bell
If you trade equities, you can point to the NZX, the NYSE, or the ASX and say: that is where the market is. Every order goes through the exchange, every trade is recorded, and there is an official opening and closing price each day.
Forex has none of this. There is no central exchange, no official price, and no consolidated tape of transactions. The market is simply the sum of all bilateral trades happening globally at any given moment. This is what decentralised means in practice.
The consequences are more significant than most beginners realise. Two brokers can display different prices for the same pair at the same millisecond, and both are technically correct — they are each reflecting the liquidity available to them through their specific provider relationships. There is no single “true” price for NZD/USD at any given instant.
Volume data is always estimated because no central authority records every transaction. When you see forex volume on your charting platform, you are seeing tick volume (how often the price changed) or your broker’s internal volume — not actual market volume.
USD 7.5 Trillion a Day, Most of It Invisible
The headline number is staggering: USD 7.5 trillion in daily forex turnover as of the most recent BIS survey. That dwarfs global equity markets combined. But that number deserves scrutiny, because most of it has nothing to do with the kind of trading retail participants engage in.
The largest component of daily forex volume is FX swaps — agreements to exchange currencies at one date and reverse the transaction at a future date. These are primarily used by institutions for hedging and liquidity management, not speculation. Spot transactions, the type closest to what retail traders do, account for roughly 28% of total volume.
Of that spot volume, retail trading represents a small fraction — estimated at around 5-6% of total market turnover. The vast majority of activity is institutional: central banks managing reserves, corporations hedging cross-border revenue, pension funds rebalancing international portfolios, and banks trading with each other for profit and liquidity.
This matters because it recalibrates expectations. Retail traders are not moving markets. We are participating in the margins of a system built for and dominated by institutions. That is not a reason to avoid the market, but it is a reason to approach it with structural humility rather than the conviction that your technical setup will overpower flows driven by central bank policy.
How Liquidity Flows Down the Chain
Prime Brokers, Aggregators, and the Tiered System
Between the interbank market and your trading platform sits a layered system of intermediaries. Think of it as a tiered distribution network, similar to how consumer goods flow from manufacturer to wholesaler to retailer.
Tier 1 is the interbank market itself — the major banks trading directly with each other. Tier 2 comprises prime brokers and large non-bank market makers. Firms like XTX Markets and Citadel Securities now account for significant forex volume without being banks at all. They access interbank liquidity through prime brokerage relationships — essentially renting the credit and connectivity of a Tier 1 bank.
Your retail broker typically sits at Tier 3. They access liquidity from Tier 2 providers, who in turn access it from Tier 1. Some larger retail brokers have prime brokerage relationships that bring them closer to the source, while smaller brokers may aggregate prices from other Tier 3 providers.
Each tier adds cost. The interbank spread on EUR/USD might be 0.1 pips. By the time it reaches your platform, it could be 0.8 to 1.5 pips, depending on your broker model and the time of day. Those intermediary margins fund the infrastructure that gives you access to a market that was, until the late 1990s, entirely closed to individual traders.
Why Retail Traders Sit at the Bottom
Retail traders occupy the last rung of the liquidity ladder, and that position comes with measurable consequences. Spreads are wider. Execution is slower. The market information available — price data, order flow, positioning — is a fraction of what institutional participants can see.
This is not a conspiracy or a design flaw. It is the natural structure of a tiered market. The same dynamic exists in property, wholesale goods, and any other market where intermediaries connect large-scale supply with small-scale demand. Each layer adds a service (access, credit, technology, regulatory compliance) and charges for it.
For NZ-based retail traders, the chain is often longer than average. Your broker may route orders through servers in London or New York, adding latency. Liquidity in NZD pairs is thinner than major pairs, which means wider spreads and more potential for slippage during fast markets. Trading during the Asian session, when NZD liquidity is highest, is one of the simplest structural advantages a Kiwi trader can use.
Understanding your position in the chain is not about resentment. It is about calibrating your expectations and strategy to match reality. A trader who understands they are at the retail end of a tiered system makes different — and generally better — decisions about execution, timing, and cost management.
ECN, STP, Market Maker: What Your Broker Actually Does
Market Makers Take the Other Side of Your Trade
A market maker broker creates its own internal market for its clients. When you buy NZD/USD, the broker takes the other side — they sell NZD/USD to you. Your profit is their loss, and your loss is their profit. This is the dealing desk or B-book model.
The immediate reaction from most traders is suspicion, and the conflict of interest is genuine. A broker that profits when you lose has a structural incentive for you to lose. But the picture is more nuanced than the forex forums suggest.
Market makers provide guaranteed fills, fixed spreads, and execution certainty that pass-through models cannot always match. During volatile markets, when ECN spreads blow out to 10+ pips, a market maker might still offer a 2-pip fixed spread. The tradeoff is that you pay for that certainty through a consistently wider spread during calm markets.
Most brokers operate a hybrid model. They run an A-book for profitable clients — passing those orders through to liquidity providers so the broker does not take the loss — and a B-book for the majority of clients who statistically lose over time. The classification happens automatically, driven by algorithms that assess each client’s trading behaviour. If you consistently generate returns, your broker is likely A-booking your trades whether they advertise it or not.
ECN and STP: Passing Your Order Through
ECN and STP brokers pass your orders through to external liquidity providers rather than taking the other side. The distinction between the two is mostly one of degree.
STP (Straight Through Processing) means your order is routed automatically to a liquidity provider without manual intervention from the broker’s dealing desk. The broker marks up the spread slightly or charges a commission. The order is matched against prices from the broker’s liquidity pool, which might include one provider or twenty.
ECN (Electronic Communication Network) goes further: your order enters a pool where it can be matched against other participants — other retail traders, institutional clients, and liquidity providers. A true ECN displays depth of market, showing available liquidity at different price levels. Spreads can be razor-thin (0.0-0.2 pips on major pairs) but commissions apply on every trade.
The practical difference a trader notices:
– Variable spreads that tighten during liquid sessions and widen during quiet periods or news events
– Potential for both positive and negative slippage — your order fills at the best available price, which might be better or worse than quoted
– Generally lower all-in costs for active traders, but less predictable execution during fast markets
– Most ECN brokers require higher minimum deposits, reflecting the institutional origins of the model
The Label on the Tin Does Not Always Match
Broker execution model labelling is marketing, not regulation. There is no global standard, no certification process, and no requirement to prove that your “ECN” broker is actually routing orders to an electronic communication network.
The Financial Markets Authority in New Zealand regulates broker conduct, capital adequacy, and client money handling. It does not certify or audit execution models. A broker can call itself ECN, STP, or “Direct Market Access” without demonstrating the claim to any regulatory body.
How can you test the reality? Several practical approaches help:
– Compare your broker’s price feed against an independent source like TradingView multi-broker data — consistent deviations suggest internalised pricing
– Place trades during major news releases and observe whether you get requotes or significant slippage — true pass-through models should show variable slippage in both directions
– Check whether your broker offers negative balance protection — this is more commonly associated with B-book models
None of these tests are definitive on their own, but patterns emerge. The honest reality is that many brokers labelled ECN run a hybrid model, and that is not necessarily a problem. What matters more than the label is the total cost of trading: spread plus commission plus slippage plus swap. Focus on measurable costs rather than marketing terminology.
The Anatomy of Your Retail Order
From Click to Fill: What Happens in 200 Milliseconds
You see NZD/USD at 0.6150 on your platform and click buy for one standard lot. Here is what happens in approximately 200 milliseconds.
Your order leaves your device and travels to your broker’s server — typically located in a data centre in London, New York, or Tokyo. If you are trading from Auckland, that is roughly 170-250 milliseconds of latency just for the round trip, depending on routing. Your broker’s server receives the order and the execution engine makes a decision.
If your broker runs a B-book model, the order is filled internally. The broker takes the other side at the quoted price (or close to it), and the process is fast — your order never leaves the broker’s system.
If your broker passes orders through, the order hits a liquidity aggregator. This software polls prices from multiple liquidity providers simultaneously and matches your order against the best available ask price. The fill price might differ from what you saw on your screen, because the market moved in those 200 milliseconds. That difference is slippage, and it can work for or against you.
For NZD/USD specifically, liquidity is thinner than EUR/USD or GBP/USD. A one-lot order will fill without issue, but larger positions (10+ lots) during quiet sessions may experience partial fills at different prices. This is why experienced traders in less liquid pairs often use limit orders rather than market orders.
Leverage, Margin, and the Broker Risk Engine
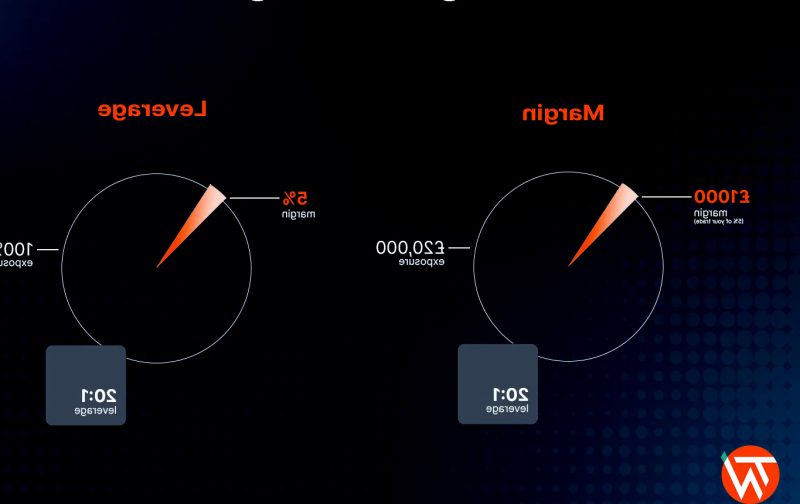
When you open a leveraged position, the mechanics on your side look simple: deposit NZD 1,000 in margin, control a position worth NZD 50,000 at 50:1 leverage. But on the broker’s side, the machinery is considerably more involved.
Your margin is collateral, not a purchase price. The broker is extending you credit for the difference between your margin and the full position value. The broker’s risk engine — a real-time system monitoring every client position simultaneously — tracks your margin usage, floating profit and loss, and proximity to margin call levels continuously.
If your position moves against you and your equity drops below the maintenance margin threshold, the risk engine triggers a margin call. If you do not deposit additional funds and the position continues to deteriorate, the broker will liquidate your position automatically at the stop-out level. This is not the broker protecting you. It is the broker protecting itself from the risk that your losses exceed your deposit.
In New Zealand, the FMA regulates broker conduct, capital adequacy, and client money handling. Higher leverage does not change your expected return — it changes your expected volatility. A 500:1 leveraged position in NZD/USD will hit a margin call from a move that would barely register on a 30:1 account. The broker’s risk engine does not care about your trading thesis. It cares about your margin ratio.
Where the System Works Against You
Information Asymmetry Is Built In
Banks, prime brokers, and large non-bank market makers see something you never will: aggregate order flow. They know where stop-loss orders are clustered because clients placed those stops through their platforms. They know where large limit orders are sitting. They can see the net positioning of thousands of traders simultaneously.
This is not illegal or unethical — it is a structural feature of being the counterparty or intermediary in transactions. A real estate agent knows what other buyers have offered. A market maker knows what other traders have ordered. The information advantage is inherent to the role.
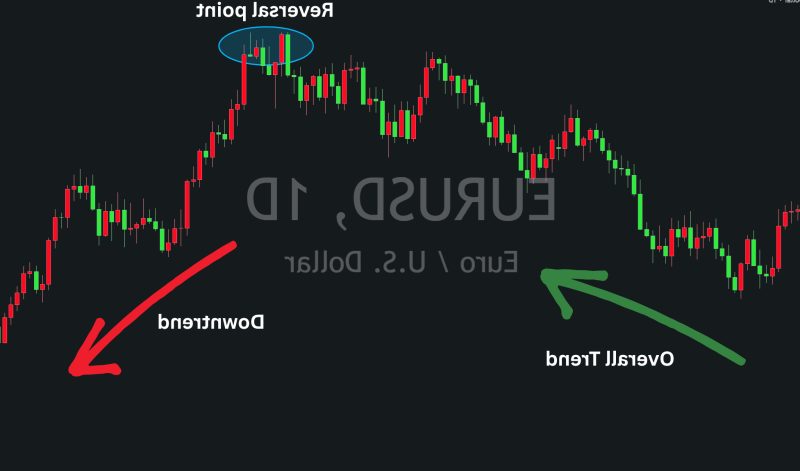
What this means in practice is that price movements around obvious technical levels — round numbers, previous highs and lows, widely-discussed support and resistance — are influenced by visible order flow. When price spikes through a support level, triggers a cluster of stop losses, and then reverses, it is tempting to cry manipulation. More often, it is the natural consequence of concentrated orders at predictable levels being absorbed by participants who can see them.
The practical takeaway: placing stops at the same level every technical analysis guide recommends means placing them where the market can see them. This does not mean stops are useless — risk management without stops is reckless. But it does mean that stop placement deserves more thought than drawing a line at the nearest round number.
Structural Awareness as a Trading Edge
Understanding market structure is not an academic exercise. It translates directly into better trading decisions, even if it does not give you an edge over a Tier 1 bank.
Broker selection becomes a cost analysis, not a marketing comparison. Once you understand the difference between B-book, STP, and ECN models, you can evaluate brokers on measurable execution quality rather than website claims. Track your average slippage over 50 trades. Calculate your true cost per trade including spread, commission, and swap. Compare that against alternatives.
Execution timing matters more than most traders realise. NZD pairs see their tightest spreads and deepest liquidity during the overlap of Asian and early European sessions. Trading NZD/USD at 3am New Zealand time, when London opens, gives you access to deep liquidity. Trading at 6pm on a Friday gives you the widest spreads of the week.
Order type selection follows from structural understanding. Market orders during volatile periods hand the advantage to faster participants. Limit orders during quiet periods let the market come to you. Traders who understand the execution chain use the right tool for the conditions.
None of this is a shortcut to profitability. But a trader who understands the plumbing makes fewer unforced errors — and in a market where most retail participants lose, reducing errors is the closest thing to an edge.
The forex market was not designed for retail traders, and no amount of optimism changes the structural realities of where we sit in the liquidity chain.
That is not a reason to avoid it. It is a reason to stop pretending the playing field is level and start making decisions — about brokers, execution, timing, and risk — that account for how the system actually works.